Diving into data-informed illustration
The brief in brief
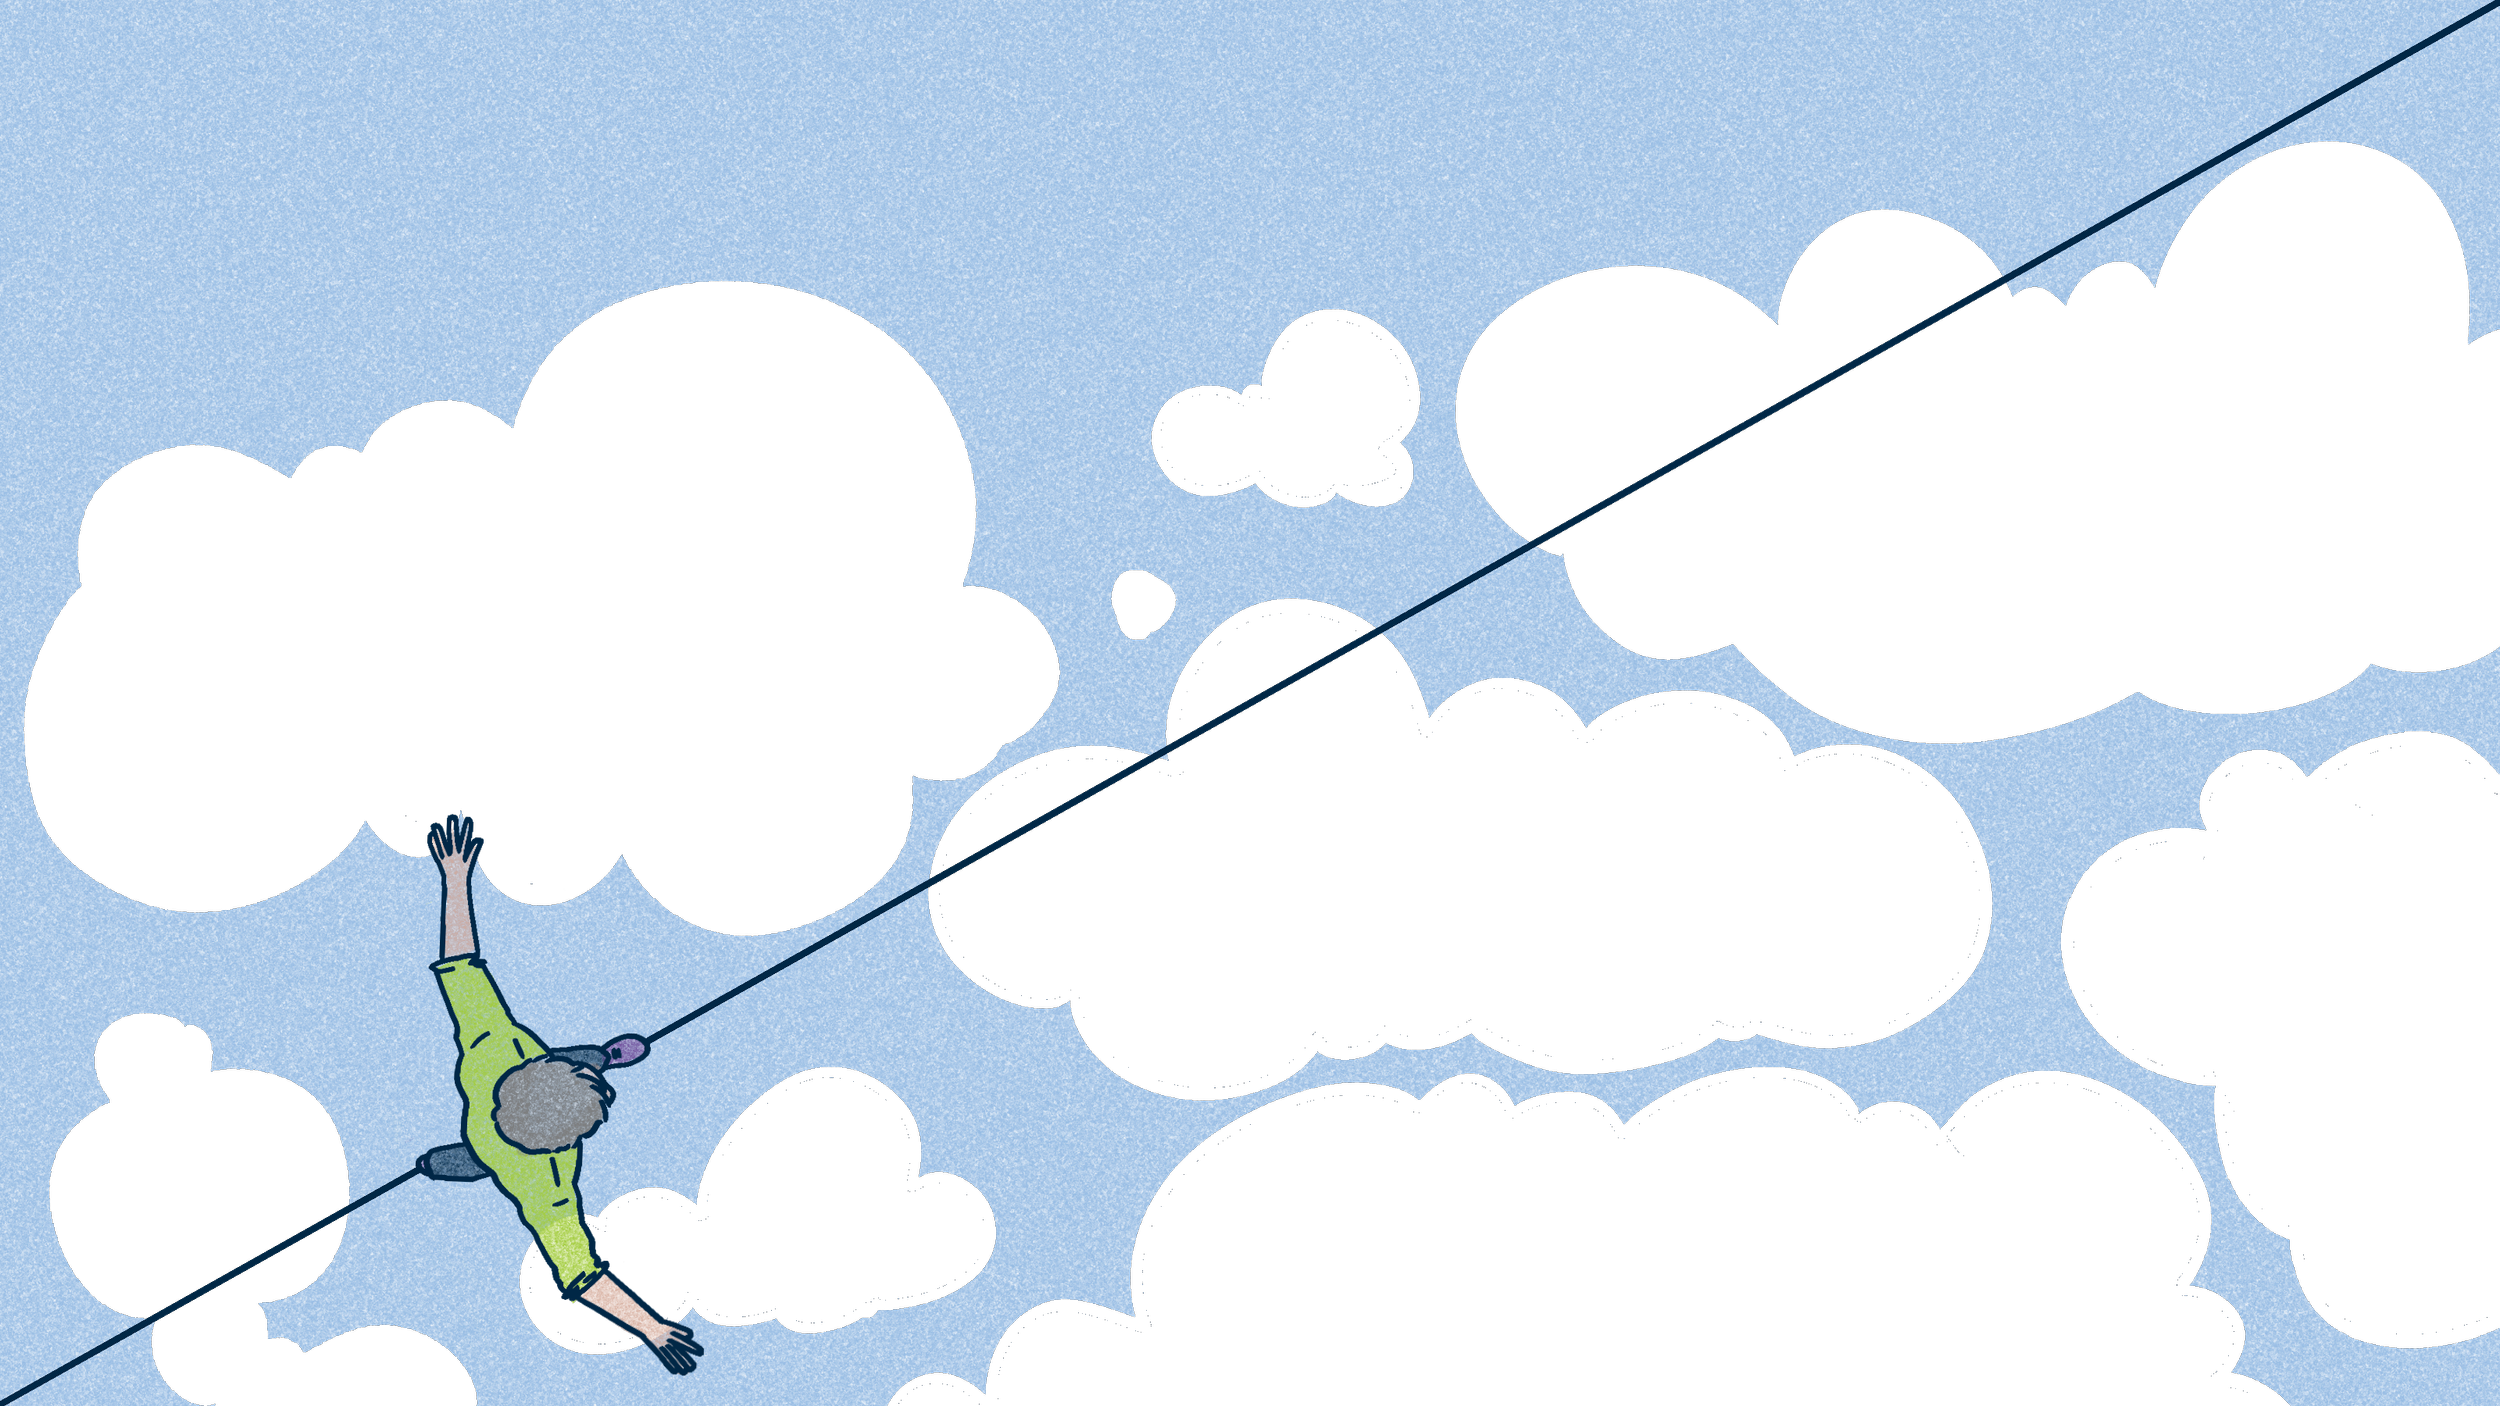
Research-focused venture capital firm Forerunner came to me to illustrate their 2024 consumer trend report. They needed a series of images and data visualisations that would make the shifts in innovations and consumer expectations tangible and easy to engage with.


The process
We started work on the images for the report before some of the final data was in, with the Forerunner team sharing briefs based on key themes and likely moments to spotlight.
For each of those 11 briefs I created a series of sketches showing how we might bring the story to life. I demonstrated approaches that we more data visualisations, including graphs and having illustrated elements interact with the data, and those which just highlighted the key narrative. In the end, I created a range of types of image, including some that had to include blank spaces to be filled by their report designer when the data was finalised. It was the first time I’d worked in that hybrid approach, but it was great to have an extra pair of eyes to make sure the detail of the data was captured as well as the wider meaning.
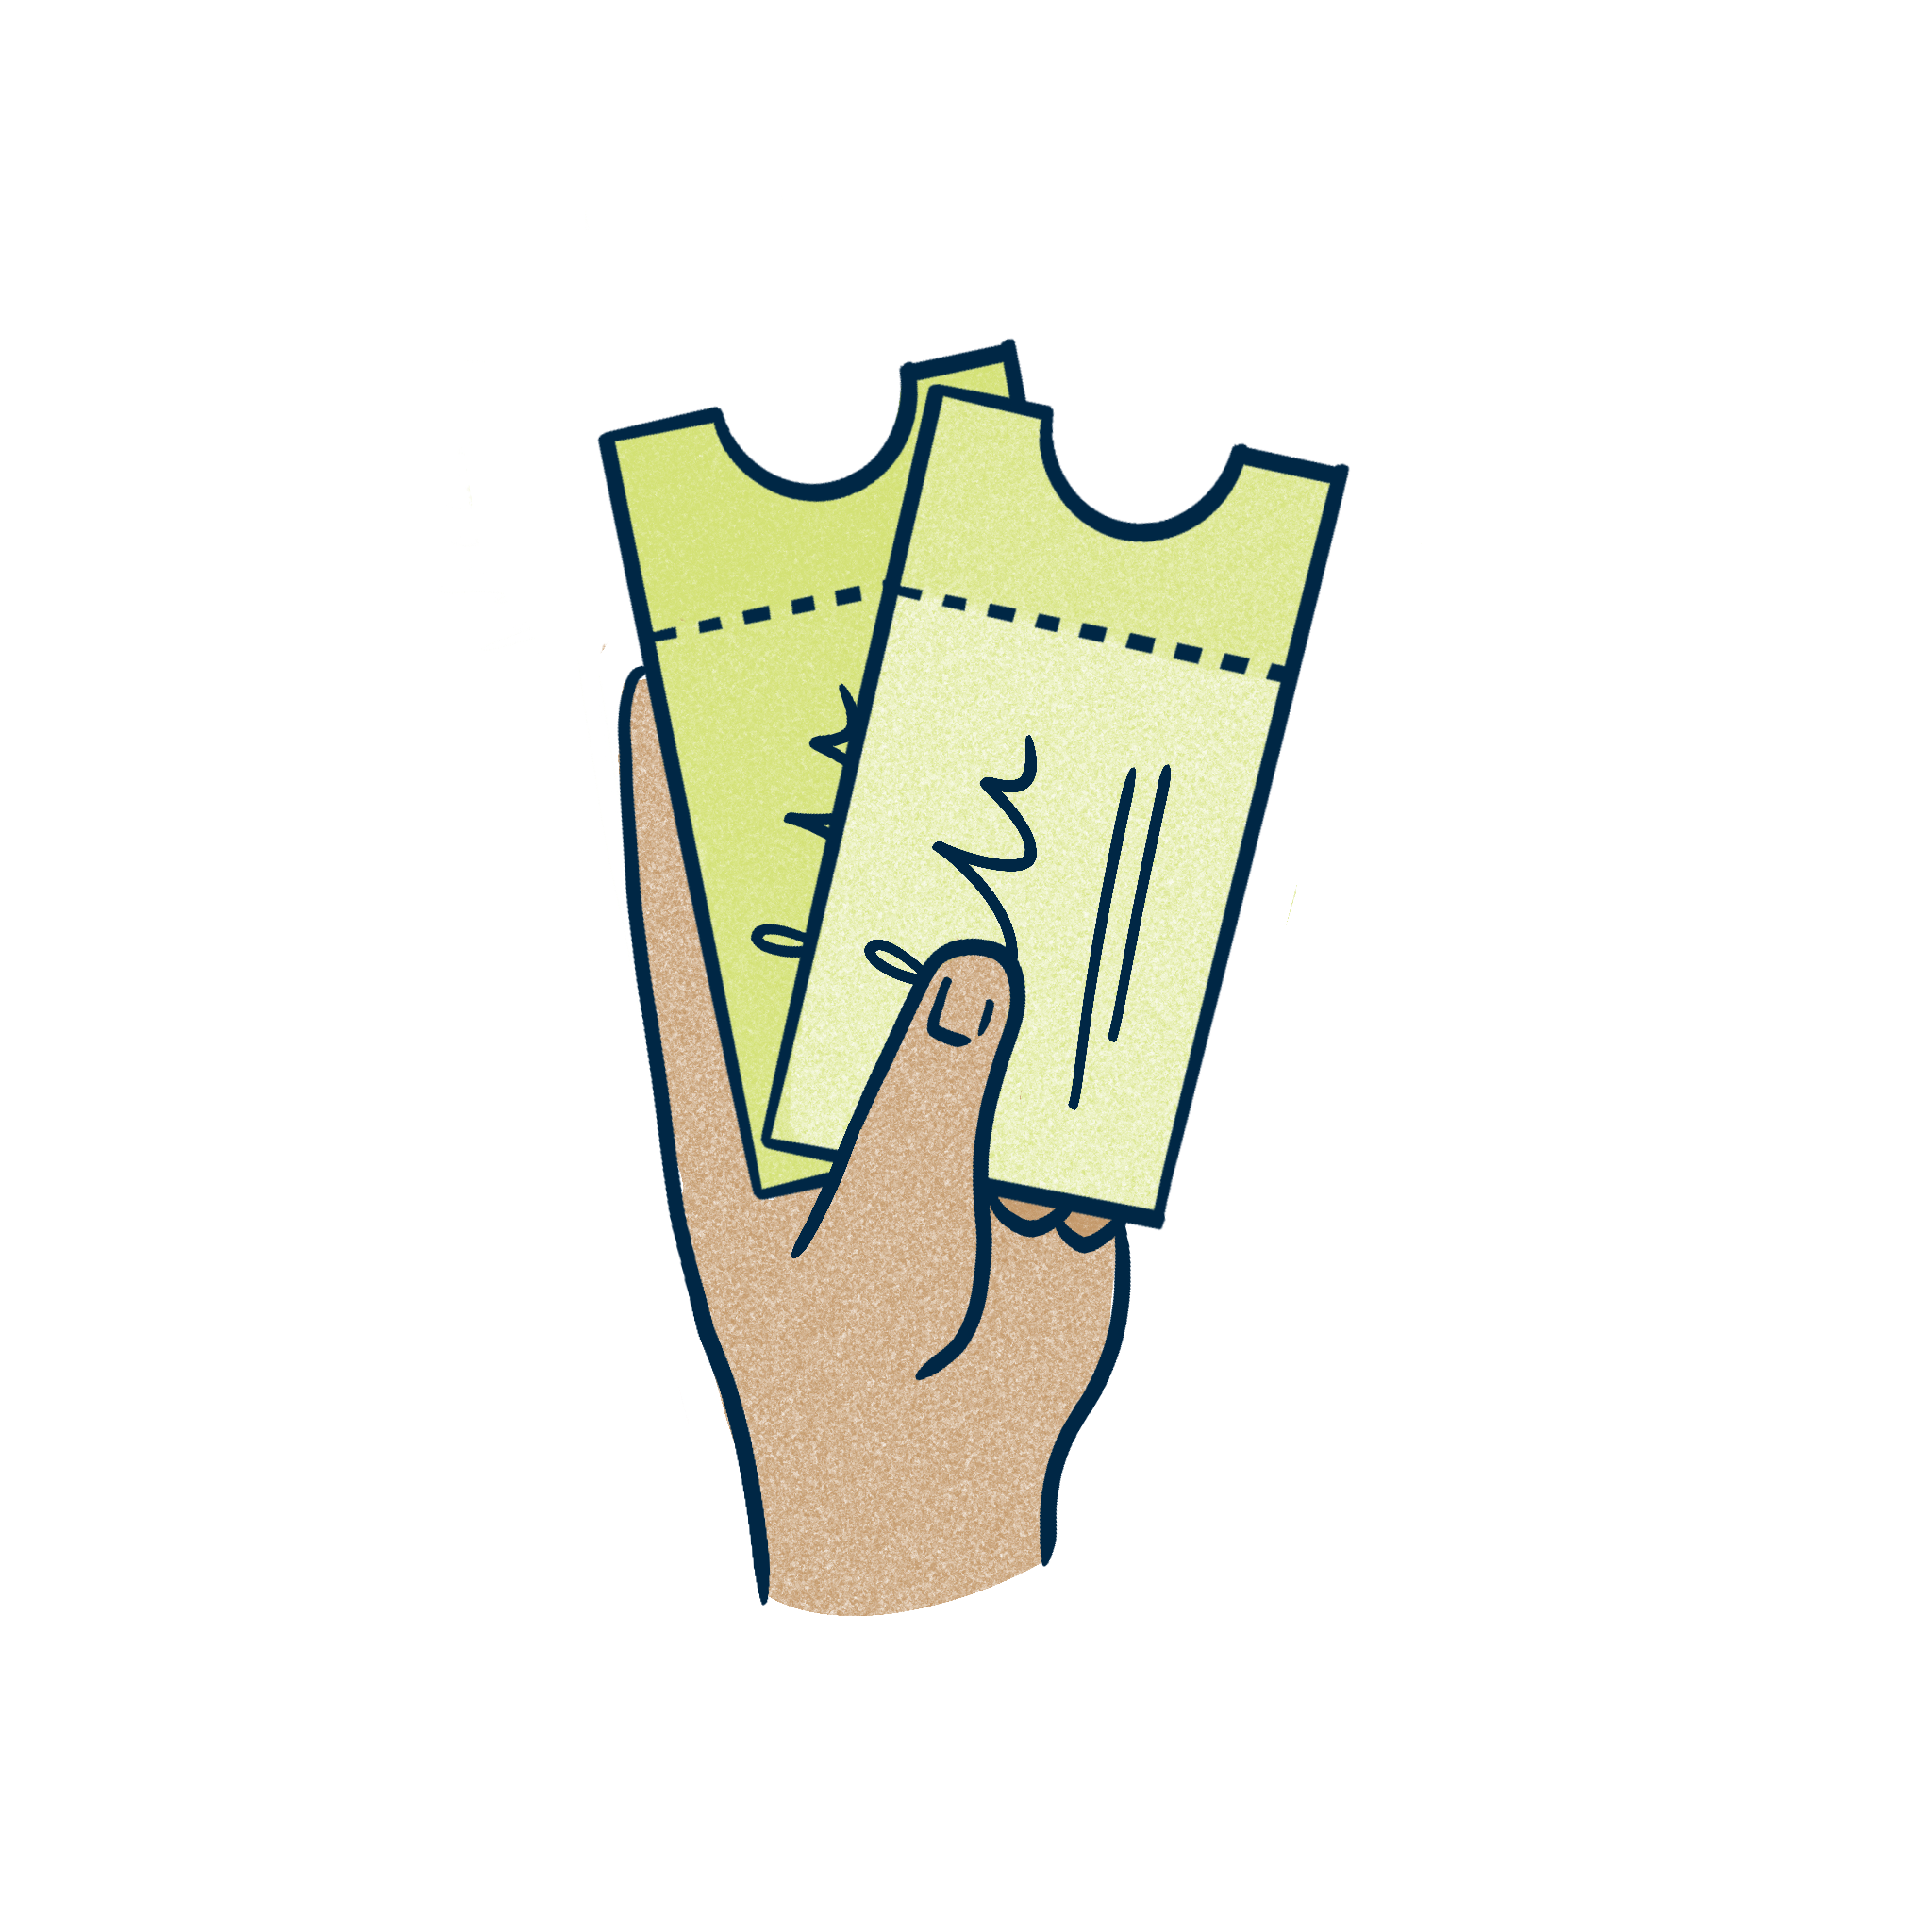
As well as the full page spreads, I designed a series of 12 spot illustrations which were used throughout the report to call out the key themes such as Generative AI and access to technology.
Across the images I looked to incorporate a loose version of their brand colour palette, inclusive modern characters and a consistent tone which felt smart but approachable.


The final product
The final report includes a range of illustrations from full page spreads, to images integrated into data visualisations and spots that highlight themes. The Forerunner team were really pleased with how the new approach “levelled up the report and made it shine“ and I’m proud to have an illustration that speaks to the cultural phenomena of The Eras tour and the Barbie movie in 2024.
